March 2014 – Monthly Commentary

March 2014

In last month’s update we speculated that the message from the Federal Reserve could soon become less accommodative as the new central bankers came to terms with the substantial liquidity sloshing through the financial system.  Just a week after publication, the Fed’s message took a decided turn at Chair Yellen’s first post-FOMC press conference.  The change in tone was delivered in three parts.  The first was the announcement that the Fed would continue to taper the size of the open market bond buying by another $10 billion.  While that was the consensus view, there were a minority of pundits that thought the weather-related weakness would force them to pause.  The second surprise came in the FOMC interest rate forecast.  The committee members each present their interest rate forecasts in the form of a histogram, with each represented as a dot corresponding to the expected Fed Funds rate at a specific date.  Surprisingly, all but two of the members forecasted that Fed Funds would be higher in 2015, with a weighted average forecast of 1.13%.  That was higher and sooner than was forecast just six weeks earlier.  The most surprising change, however, came during the question and answer period when Chairwoman Yellen suggested that the first rate hike would come six months after the end of quantitative easing.   Investors were jolted from the “low rates for an extended period” mentality into the realization that the Fed now expects to raise rates in the foreseeable future.  Barring any unanticipated calamity, it now seems likely that quantitative easing will end on October 29 and the first rate hike will occur six months later, at the conclusion of the April 30th FOMC meeting.  Moreover, given the forecast of the FOMC members, Fed funds will likely end 2015 at 1% or above.


Ironically, in a subsequent speech three weeks later, Yellen attempted to put the rate hike “genie” back in the bottle.  Speaking in Chicago before a Community Reinvestment conference, her speech was highly sympathetic and included a reference, by name, to three individuals that have suffered through the plight of unemployment during the recession.  The humanization of unemployment was a highly unusual tactic for a Fed Chairman.  Historically, the mandate of the Fed is to be a countercyclical macro force, easing policy when economic growth slows and tightening as it accelerates, agnostic to the woes and fortunes of the individual.  In an ironic twist, it was reported the next morning that two of the three named had criminal records.  It’s unfortunate that Yellen resorted to political tactics to communicate policy, as it only served to undo the credibility that she had gained just a few weeks earlier.


We’ve discussed the Fed’s Fixed Interest Rate Reverse Repo (FIRRP) operations on several occasions, in the monthly review, and during our in-person client meetings.  Since the newest round of operations was launched last September, the size and participation has steadily grown.  The FIRRP is effectively a one day Federal Reserve “bill” available to a select list of 125 financial institutions and money market funds, and currently has a fixed yield of 5 basis points per annum.  As a result of the government’s money printing exercise, there is a surfeit of cash in the financial system and the demand for short maturity fixed income securities has become acute.  The demand has been so great that the yield to maturity of Treasury bills falls into negative territory with consistent regularity.  To offset that imbalance, the Fed issues up to $5 billion FIRRP’s per investor.   As last year came to an end, issuance of the one day security ballooned to more than $100 billion before settling back into a daily volume of approximately $60 billion.  Going into the end of the first quarter, the excess cash was even more acute than year-end as evident in the $242 Billion in FIRRP issued on the last day of March.  Despite nearly a quarter Trillion dollars of collateral provided by the government, Treasury bill yields again fell close to zero.  For now, the Fed seems to be managing the excess liquidity imbalance with FIRRP.  But the larger issue is the enormity of the liquidity in the system and how it will be managed as the economy accelerates.  Our early speculation is that the FIRRP will replace Fed Funds as the policy setting interest rate.  Indeed, the Fed has suggested that they could manage the money supply by adjusting the rate on the security as they see fit.  With interest rates at 5 basis points and Treasury Bills yielding 0.00%, the FIRRP is an effective tool.  However, as interest rates normalize, sopping up nearly a trillion dollars of liquidity rapidly becomes an unwieldy and expensive undertaking.  Each one percent rise in interest rates would cost the U.S. Government nearly 8 billion dollars.  That’s assuming that the Fed maintain the current $5 billion cap per institution.  Should they need to increase the cap to meet heightened liquidity, which seems likely, the cost could be even greater.  We expect the Fed would quickly come under intense criticism for incurring such cost, especially since they are likely to be sitting on a multi-trillion dollar portfolio of Treasury and Mortgage-backed securities that are valued well below their purchase price.  When that day arrives the brilliance that quantitative easing is perceived as being is not likely to look so brilliant.


Financial Times – 4/11/13

Michael Kastner, principal at Halyard Asset Management, said the growth potential for biotechs remained promising but the sector had become expensive.

“In terms of investment stories, it’s good for investors but prices have run up so much that I think we are seeing some aggressive traders pushing it around.”

Asia and Europe feel the pain as US tech rout spreads


Financial Times – 4/8/14

“We are at a very late stage in the high-yield rally,” says Michael Kastner, principal at Halyard Asset Management. “But people chasing yields look at how well these bonds did in the last couple of years and assume they can replicate that.”

Junk bond investors dig deep for value

Financial Times – 4/3/14

“A strong jobs number should see the S&P 500 push through 1,900 as the data will force the doubters off the sidelines and back into stocks,” said Michael Kastner, principal at Halyard Asset Management. “If we get a weaker number the market will reset a little lower and wait for further data.”

US equity bulls confident growth will speed up

Corporate Profit Growth Fuels Shareholder Returns through Dividends and Repurchases

Corporate Profit Growth Fuels Shareholder Returns through Dividends and Repurchases

Share repurchases by S&P 500 companies increased 19% in 2013 – with a total of $129.4 billion executed in the fourth quarter.  This was a 1% increase compared to the 3rd quarter and when combined with quarterly dividends, represents the second highest quarter of dollars returned to shareholders on record.  The previous high was recorded in 2007.

The share reduction has been widely quoted as being the primary driver of the 15% rally in the S&P index during the 2nd half of 2013.  Below, we take a look at the statistics in greater detail.

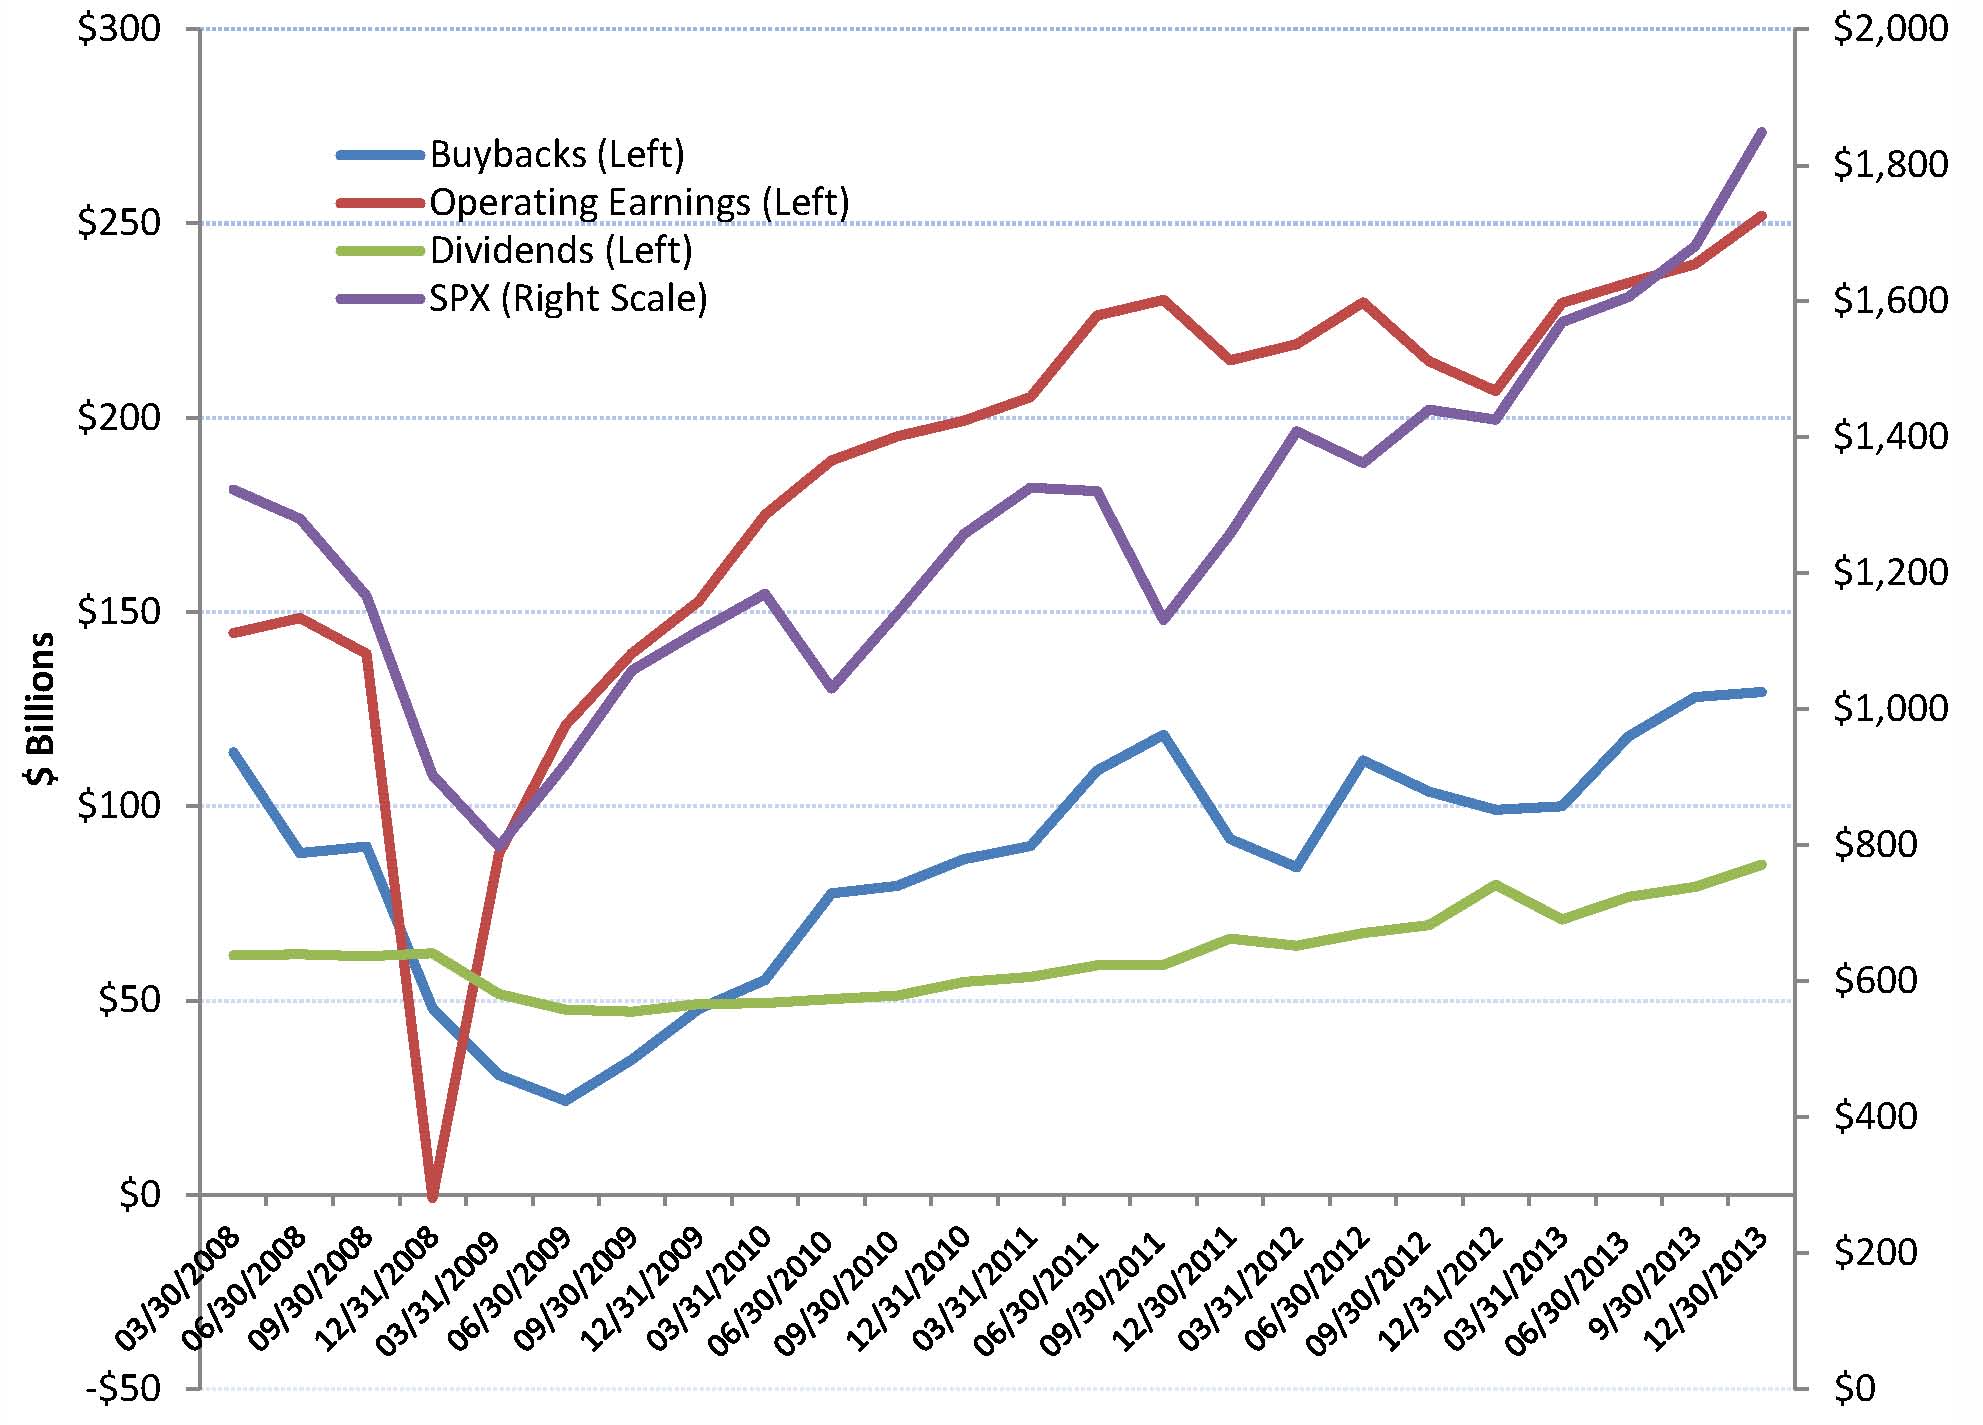
Chart one, details the quarterly dollar amounts of dividends, buybacks and operating earnings on the left scale.  The quarterly S&P 500 Index is graphed on the right scale.  As the economy recovered from the 2008 recession, we have seen steady growth in the quarterly dividends and an upward trend in buybacks – although at a slightly more erratic path.  Intuitively, dividends and repurchases track operating profits.  The S&P 500 index tracks operating profits pretty closely.

Chart 1:

Source: S&P – Quarterly Buybacks, Operating Earnings, Dividends and S&P 500 Index.  Data is through December 31st, 2013 (Preliminary).


Chart two, compares the dollar amount of quarterly repurchases to operating earnings and market capitalization.  Interestingly, repurchases have averaged about 45% of operating profits since 2008.   For 2013, repurchases averaged 49.7% of operating earnings, with the last two quarters exceeding 50%.   The second line on chart two depicts share repurchases as a percent of the S&P market capitalization.  Buybacks have averaged 74bps of market cap since 2008.  Looking at the chart, one might conclude that the buybacks have been a relatively stable percent of market cap, except for the 3rd quarter of 2011 – when buybacks continued to inch higher and stocks sold off 15% due to the US debt default debacle.

Chart 2:

 Source: S&P, Repurchases as a percent of operating earnings and as a percent of S&P 500 market capitalization.


Chart Three depicts the dividend yield, the combined dividend and buyback yield with an overlay of the quarterly buyback dollar amount.  Both the dividend yield and the buyback yield have remained fairly stable over the last three years – a result of the slow rise in each coupled with the price rally in stocks.

Chart 3:

Source: S&P, Quarterly dividend yield and the combined dividend yield and buyback yield.


After recovering in 2009 and 2010, operating profit growth looks slow and steady.  Recall that dividends spiked during the 4th quarter of 2012 – ahead of tax increases.  We believe that the growth in dividends and buybacks will continue as corporate profitability increases.  The last few years, economic growth, as measured by GDP, increased 2.0% to 2.6%.    With the US poised to potentially reach a 3% rate growth rate, we believe corporate profit growth may accelerate.  As the rate of growth increases – pushing corporate profits higher, dividend and buyback growth should continue.

Chart 4:

Source: S&P, Quarterly growth in dividend yield and the operating earnings.


Important Statement

This document is being provided by Halyard Asset Management, L.L.C. and its affiliates (collectively “Halyard” or “we”) for informational and discussion purposes only and does not constitute, and should not be construed as, investment advice, or a recommendation with respect to the securities used, or an offer or solicitation, and is not the basis for any contract to purchase or sell any security, or other instrument, or for Halyard to enter into or arrange any type of transaction as a consequence of any information contained herein. Any such offer or solicitation shall be may only be made at the time a qualified investor or client receives (i) a confidential private placement memorandum of the Halyard Fixed Income Fund, L.P. (the “Memorandum”), which describes risks related to an investment therein, or (ii) an Investment Advisory Agreement (“Advisory Agreement”). The Memorandum, including the risk factors and potential conflicts of interest described therein, or the Advisory Agreement should be read carefully prior to investment.  In the event of any inconsistency between this document and the Memorandum or Advisory Agreement, as the case may be, the Memorandum or Advisory Agreement will govern.  An invest in the Halyard Fixed Income Fund or a separately managed account may involve significant risks including the risk of loss of the amount invested.  In addition, certain investment practices employed including short selling and engaging in futures and options trading, may potentially increase the adverse impact on the Halyard Fixed Income Fund, L.P. or a separately managed account.

Although the information herein has been obtained from public and private sources and data that we believe to be reliable, we make no representation as its accuracy or completeness. The views expressed herein represent the opinions of Halyard Asset Management, LLC, or any of its affiliates, and are not intended as a forecast or guarantee of future results.  Opinions and estimates involve a number of assumptions that may not prove valid and may be changed without notice. Performance comparisons may not take into account any transaction costs, commissions or personal taxes. Past performance is no guarantee of future results and no assurance can be given that the Halyard Fixed Income Fund or a separately managed account would achieve favorable or comparable investment results or that the Halyard Fixed Income Fund, or a separately managed account’s, investment objectives will be achieved or that the investor will receive a return of all or part of their investment. There can be no assurance that any estimated returns or forward looking assumptions contained in enclosed materials will be realized or that actual results will not be materially lower than those estimated.  There is always the chance that investment performance might deteriorate in the future, and clients may experience capital losses in the market value of their portfolios due to material market or economic conditions.