Corporate Profit Growth Fuels Shareholder Returns through Dividends and Repurchases
Corporate Profit Growth Fuels Shareholder Returns through Dividends and Repurchases
Share repurchases by S&P 500 companies increased 19% in 2013 – with a total of $129.4 billion executed in the fourth quarter. This was a 1% increase compared to the 3rd quarter and when combined with quarterly dividends, represents the second highest quarter of dollars returned to shareholders on record. The previous high was recorded in 2007.
The share reduction has been widely quoted as being the primary driver of the 15% rally in the S&P index during the 2nd half of 2013. Below, we take a look at the statistics in greater detail.
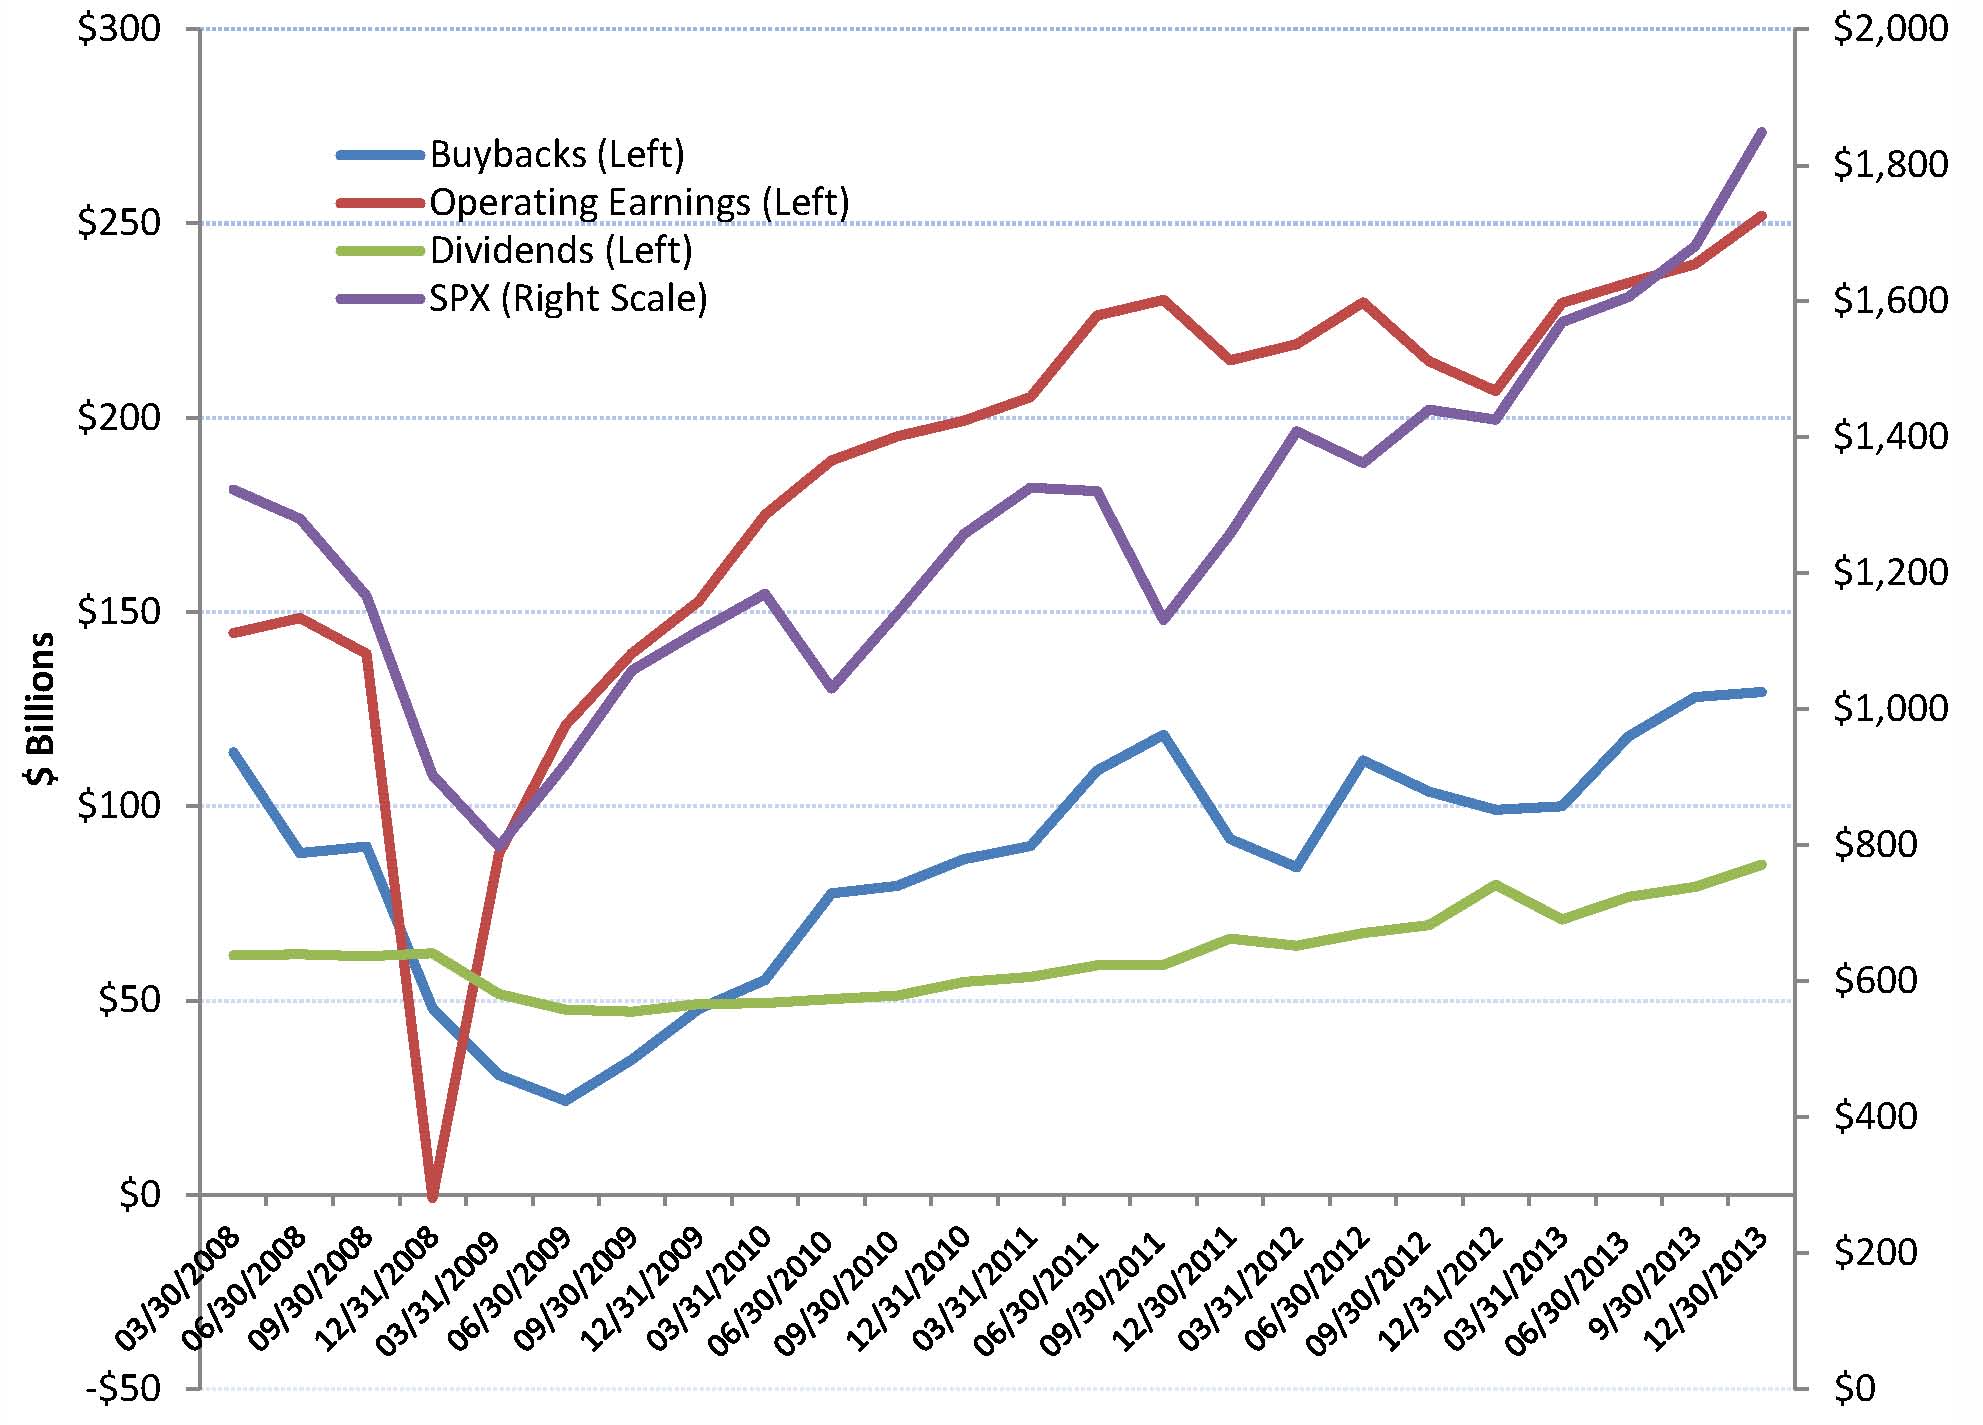
Chart one, details the quarterly dollar amounts of dividends, buybacks and operating earnings on the left scale. The quarterly S&P 500 Index is graphed on the right scale. As the economy recovered from the 2008 recession, we have seen steady growth in the quarterly dividends and an upward trend in buybacks – although at a slightly more erratic path. Intuitively, dividends and repurchases track operating profits. The S&P 500 index tracks operating profits pretty closely.
Chart 1:

Source: S&P – Quarterly Buybacks, Operating Earnings, Dividends and S&P 500 Index. Data is through December 31st, 2013 (Preliminary).
Chart two, compares the dollar amount of quarterly repurchases to operating earnings and market capitalization. Interestingly, repurchases have averaged about 45% of operating profits since 2008. For 2013, repurchases averaged 49.7% of operating earnings, with the last two quarters exceeding 50%. The second line on chart two depicts share repurchases as a percent of the S&P market capitalization. Buybacks have averaged 74bps of market cap since 2008. Looking at the chart, one might conclude that the buybacks have been a relatively stable percent of market cap, except for the 3rd quarter of 2011 – when buybacks continued to inch higher and stocks sold off 15% due to the US debt default debacle.
Chart 2:

Source: S&P, Repurchases as a percent of operating earnings and as a percent of S&P 500 market capitalization.
Chart Three depicts the dividend yield, the combined dividend and buyback yield with an overlay of the quarterly buyback dollar amount. Both the dividend yield and the buyback yield have remained fairly stable over the last three years – a result of the slow rise in each coupled with the price rally in stocks.
Chart 3:

Source: S&P, Quarterly dividend yield and the combined dividend yield and buyback yield.
After recovering in 2009 and 2010, operating profit growth looks slow and steady. Recall that dividends spiked during the 4th quarter of 2012 – ahead of tax increases. We believe that the growth in dividends and buybacks will continue as corporate profitability increases. The last few years, economic growth, as measured by GDP, increased 2.0% to 2.6%. With the US poised to potentially reach a 3% rate growth rate, we believe corporate profit growth may accelerate. As the rate of growth increases – pushing corporate profits higher, dividend and buyback growth should continue.
Chart 4:

Source: S&P, Quarterly growth in dividend yield and the operating earnings.
Important Statement
This document is being provided by Halyard Asset Management, L.L.C. and its affiliates (collectively “Halyard” or “we”) for informational and discussion purposes only and does not constitute, and should not be construed as, investment advice, or a recommendation with respect to the securities used, or an offer or solicitation, and is not the basis for any contract to purchase or sell any security, or other instrument, or for Halyard to enter into or arrange any type of transaction as a consequence of any information contained herein. Any such offer or solicitation shall be may only be made at the time a qualified investor or client receives (i) a confidential private placement memorandum of the Halyard Fixed Income Fund, L.P. (the “Memorandum”), which describes risks related to an investment therein, or (ii) an Investment Advisory Agreement (“Advisory Agreement”). The Memorandum, including the risk factors and potential conflicts of interest described therein, or the Advisory Agreement should be read carefully prior to investment. In the event of any inconsistency between this document and the Memorandum or Advisory Agreement, as the case may be, the Memorandum or Advisory Agreement will govern. An invest in the Halyard Fixed Income Fund or a separately managed account may involve significant risks including the risk of loss of the amount invested. In addition, certain investment practices employed including short selling and engaging in futures and options trading, may potentially increase the adverse impact on the Halyard Fixed Income Fund, L.P. or a separately managed account.
Although the information herein has been obtained from public and private sources and data that we believe to be reliable, we make no representation as its accuracy or completeness. The views expressed herein represent the opinions of Halyard Asset Management, LLC, or any of its affiliates, and are not intended as a forecast or guarantee of future results. Opinions and estimates involve a number of assumptions that may not prove valid and may be changed without notice. Performance comparisons may not take into account any transaction costs, commissions or personal taxes. Past performance is no guarantee of future results and no assurance can be given that the Halyard Fixed Income Fund or a separately managed account would achieve favorable or comparable investment results or that the Halyard Fixed Income Fund, or a separately managed account’s, investment objectives will be achieved or that the investor will receive a return of all or part of their investment. There can be no assurance that any estimated returns or forward looking assumptions contained in enclosed materials will be realized or that actual results will not be materially lower than those estimated. There is always the chance that investment performance might deteriorate in the future, and clients may experience capital losses in the market value of their portfolios due to material market or economic conditions.
