
The Federal Reserve’s June meeting was viewed as a hawkish shift. A shift in rhetoric only, as the Fed will maintain its current ultra-easy monetary policy for the near future. Recall from the previous FOMC meeting on April 28th, Powell reiterated that they believe the uptick in inflation will prove transitory and they were comfortable with the status quo. When pressed on whether the committee had begun discussions on how taper would be enacted, he responded that they “haven’t even talked about talking about taper.”
At the June 16th FOMC meeting, the Fed surprised with a hawkish shift in tone. The Fed reiterated its belief that inflation will be transitory as the economy reopens. At the same time, it said that supply constraints may lead to inflation being more persistent than thought only a few weeks prior. It appears that the Fed succumbed to the pressure from former Fed officials, other prominent financial figures and a steepening yield curve during the intermeeting period– the thesis was that the Fed was getting behind the curve and letting the economy run too hot.
The Fed’s patience is likely to become more difficult to defend as the economy is operating at a robust pace, with more and more activity coming back online. The May Consumer Price Index rose 5.0% year-over-year, above the 4.7% consensus expectation, with nearly all segments showing price appreciation. To be sure, anyone that actually buys anything, drives anywhere or just dines out knows that inflation is higher and more broad based than government bean counters will admit. Add to this, higher wage growth and worker demands for additional pay and we seem to be building the case for more persistent inflation in the near term as opposed to a transitory blip in the CPI figures that the Fed insists is the case.
Lest we forget the fiscal stimulus already enacted – the likes of which we have not seen in generations. The US is nearing the passage of another $1 trillion infrastructure package. This has the potential to further push inflation up as spending on projects reverberates throughout the economy. Adding to fiscal stimuli, State and Local Government spending is also increasing at an alarming rate. The State of California’s revenues exceed expectations by more than $75 billion – and they have every intention of spending it, as seen by the 30% increase in its budgeted expenditures for this coming fiscal year.
Furthermore, as of today, the Fed’s balance sheet is in excess of $8 Trillion. The excess reserves are not being leant by banks, but being reinvested at the Fed and in the markets. In other words, the massive amount of liquidity that Fed created, isn’t yet being fully spent in the economy – it is being saved. We are concerned that as the US continues to reopen and those on the sidelines come back into the workforce they will start to spend. An increase in the rate of spending known as the velocity of money combined with the massive amount stimulus in the pipeline may lead to further increases in prices.
Increasing inflation erodes the value of a fixed income instrument. The chart below depicts the real yield on the 10-year US Treasury note dating back to 1965. The real yield on the 10-year note has averaged 2.2% since 1965 – meaning that the yield on the 10-year note exceeded inflation by an average of 2.2% over that time. To be fair, given outsourcing, globalization and technological improvements in recent decades, the real yield has fallen. Since 2000, the real yield on the 10-year note has averaged just 1.10%.
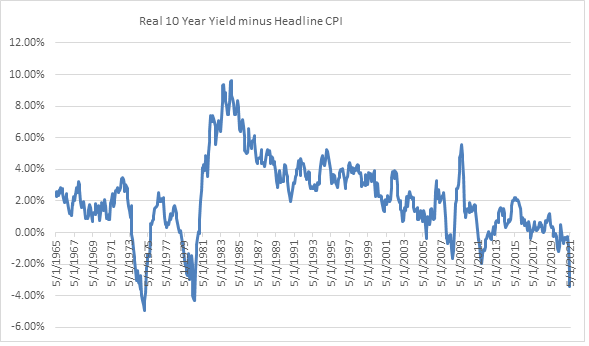
Source: Bloomberg
So let us back into where 10-year interest rates might be and assume for the sake of argument that the Fed is correct in its transitory inflation forecast and inflation averages 2.2% year over year for the next few years. Let us assume investors demand just 1% real yield. The table below shows that the yield to maturity on the 10-year note should be closer to 3.2%. We close the 2nd quarter 2021 with the 10-year yield to maturity of 1.45%. Should yields rise to 3.2% sharply, the price of the 10-year note would fall from approximately $101.6 to $87.92 – more than 13 points.
| 10 Year US Treasury Note | For Illustration | Current | Estimate** | |
| 2/28/2019 | 6/30/2021 | 6/30/2022 | ||
| Yield to Maturity | 2.69% | 1.45% | 3.20% | |
| CPI – YOY% | 1.50% | 5.00% | 2.20% | |
| Real Yield | 1.19% | -3.55% | 1.0% | |
| Price of 10-year Note* | $ 101.60 | $ 87.92 | ||
| * Estimated price change using the current 10-year note T 1.625% 5/15/31; ** Assumes inflation averages 2.2% | ||||
We think that the Fed will announce plans to taper its $120 billion a month bond buying program at the September or November FOMC meeting. And, as a base case, we expect a gradual tapering over the course of the next 12 to 18 months thereby putting the first interest rate hike into the 4th quarter of 22 or the first quarter of 2023.
Given an unattractive return potential of longer maturity fixed income and the Fed’s possible tapering plans – how are we positioned in the Halyard’s Reserve Cash Management portfolio? We think that the front end will remain somewhat anchored and pegged to the outlook for the first rate hike, which we see as at least one year from today.
With that outlook in mind, we have positioned the portfolio in very short maturity investment grade corporate notes, short-term high quality municipal notes and short-term US Treasury Notes. The average credit quality of the portfolio is Single A. The average maturity of the portfolio stands at 390 days with a duration of .76 years. Approximately 67% of the portfolio matures in less than one year – providing us with the opportunity to reinvest as interest rates rise.
Disclosures
This document is for informational purposes only, is intended only for the named recipient and is not intended as an offer or solicitation for the purchase or sale of a security or other financial product. This document includes information which we believe to be reliable but we do not represent that is accurate or complete and it should not be relied upon as such. Information in this document is as current as the date above.
Portfolio Characteristics: The figures presented above represent the weighted average duration, maturity, yield, and rating for the portfolio holdings of the portfolio, and may vary over time. Credit quality ratings are defined by Moody’s, S&P and Fitch and are subject to change at any time.